The Economics of AI Operations: Tokens, GPUs, Latency and Energy
An AI service has a bill that moves with use, a latency that moves with load and a quality that can move without anyone touching it. This chapter treats the economics of running AI as an operations problem: what a request costs in tokens, accelerator time, seconds and energy, how latency and quality objectives are traded against cost, how a service falls back when its primary path fails, and how an agent's spend is bounded when it can loop. The operator's question is what to spend, where and with which stop. The chapter concerns O5 Sustain, because capacity, cost and energy are the quantities that keep an estate fit over time, and O1 Observe, because none of them can be governed unless the cost, the latency, the quality and the energy of each AI service are measured at the point where they arise and by something that does not depend on the service.
The chapter builds on the earlier volumes. AI Governance, Chapter 6, set a risk-tiered position that decides which models may handle which data (F30) (296, Nordqvist, 2026), and its Chapter 16A treated cost and portfolio decisions, so this chapter takes the decision to fund a service as made and concerns how the running spend is bounded. AI Platform and Security, Chapter 13, defined sovereignty as verifiable properties (F47), and its Chapter 22 set out cost, capacity and sustainability for the platform (297, Nordqvist, 2026). AI Threat, Chapters 25 and 26, recorded the pattern of agents acting beyond their mandate and the erosion of fallbacks (F67, F69) (299, Nordqvist, 2026). AI Blue, Chapters 16 and 28, concluded that a contract right is only a promise until a test shows it works (F111) (302, Nordqvist, 2026). AI Purple, Chapter 14, described the loop's own AI as narrow functions under mandates with budgets, circuit breakers and a drilled stop (F130). Chapter 4 defines the autonomy budget, the action classes and the observer principle applied here.
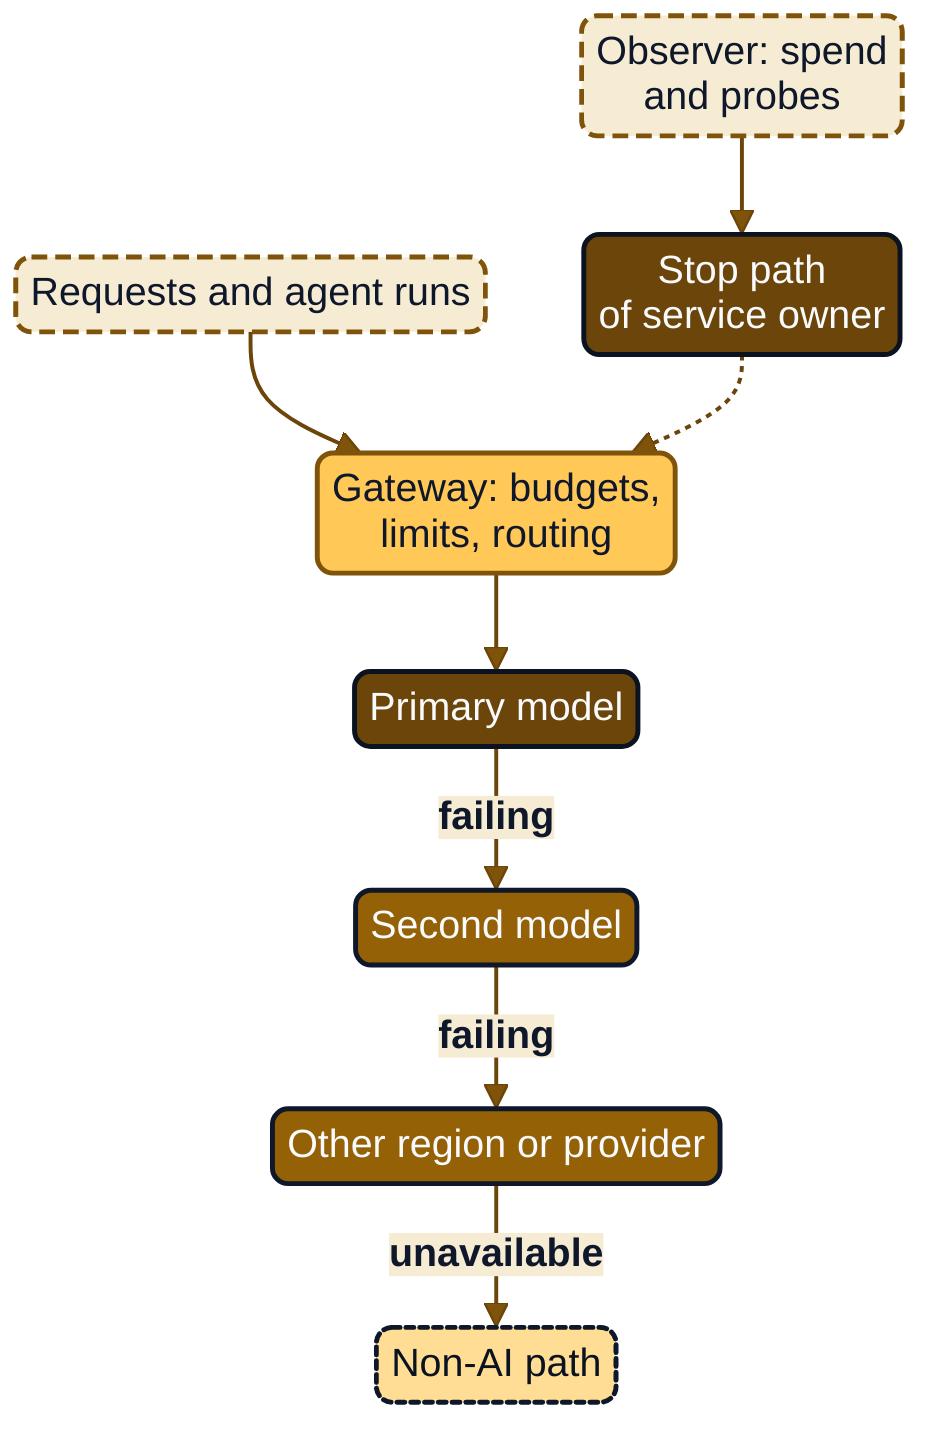
Figure 15.1: A gateway that enforces budgets, the four-rung fallback ladder, and the observer and the stop path outside the gateway.
What a request costs
The cost of an AI request is easy to state for a metered API and harder to state for capacity the organisation holds, and the two cases need different arithmetic before they can be compared.
Metered inference
For a hosted model billed by the token, the cost of one call is the sum of the input tokens at the input price, the output tokens at the output price, and any cached or batch variants of either. One provider's published list prices, as they stood on 2026-11-10, show the structure that matters (288, Anthropic, n.d.). Output tokens are priced at five times the input price in every row of the page's model table. The smallest and the largest current model differ by a factor of 80 in input price. Reading a cached prompt prefix costs a fraction of the base input price, written as a multiplier of 0.1 for most models on the page and lower for some, and the provider's batch interface carries a 50 per cent discount on both input and output tokens in exchange for asynchronous processing. The page also records a 10 per cent premium for regional and multi-region endpoints on two cloud platforms and a 1.1 multiplier for inference pinned to a single geography on the first-party interface. These figures are list prices, they change, and they are one provider's. They are cited for the shape they show: price depends on direction (input or output), on model size, on whether the prefix repeats, on whether the answer can wait and on where the inference may run.
Four consequences follow. First, the cost of a request cannot be estimated from the length of the user's message, because the billed input includes the system prompt, the conversation history and retrieved content (283, FinOps Foundation, 2026). Second, a change of prompt, retrieval depth or output limit is a change of cost and belongs in a change record (Chapter 8) with a cost estimate beside the quality result. Third, a location constraint is a price line, and the budget should carry it. Fourth, the split between interactive and deferrable work is a saving a service owner can choose: summarising last month's incidents does not need the interactive path.
Agents multiply the unit
For an agent the unit of cost is the run and not the call. A run consists of several model calls interleaved with tool calls, and each call resends the context accumulated so far. The arithmetic is the book's own and not a measurement. If every step adds about k tokens to the context and the whole context is resent at each step, the input tokens billed over n steps are roughly k times n(n+1)/2, so a run that takes twice as many steps costs close to four times as much in input tokens unless caching absorbs the repeated prefix. A loop that does not terminate is the quadratic case with no end. The budget of an agent is therefore expressed per run as well as per day, because a daily cap alone lets a single looping run consume the day before anyone sees it (Chapter 16 treats the agent team and its mandates).
Self-hosted and reserved capacity
For capacity the organisation reserves or owns, the cost is largely fixed and the unit cost is a quotient: the cost of the accelerators, the host systems, the energy, the facility share and the operating staff, divided by the requests served in the period. The denominator is the quantity that moves. A pool that is paid for and half used costs twice as much per request as the same pool kept busy, and a pool run close to saturation costs little per request and a great deal in latency, which this chapter returns to below. Reservation is cheaper than on-demand capacity only above a utilisation threshold, the ratio of the reserved price to the on-demand price for the same hours: a reservation priced at 60 per cent of on-demand pays for itself only if the pool is used more than 60 per cent of the time.
Throughput on a given pool depends on the serving software. Kwon and colleagues reported that their serving system raised the throughput of popular language models by two to four times at the same latency as the systems they compared against, by managing the memory that holds each request's context so that more requests fit in a batch (281, Kwon et al., 2023). That is a comparison between serving systems on the authors' workloads. The inference for the operator is the book's own: a change of serving stack or batching configuration can change a pool's capacity more than most purchasing decisions, so it is a capacity event, load-tested and recorded, and a capacity figure carries the configuration it was measured on.
Cost per outcome, as a distribution
A cost per request is a means to an end. The FinOps Foundation recommends measuring the use case and not the token alone, and lists cost per inference, cost per successful outcome, cache hit rate, accelerator utilisation and model fit, the share of requests sent to a more expensive model than the task needs, and recommends reporting distributions because AI cost varies from run to run (283, FinOps Foundation, 2026). A record therefore states the 50th, 95th and 99th percentile of cost per run, since the tail is where a runaway sits, and cost per successful outcome with the quality bar that defines success.
Price falls and the bill
Epoch AI reviewed the results of state-of-the-art models on six benchmarks over about three years and measured how quickly the price per million tokens fell for a fixed level of capability. For performance at the level of GPT-4 on a set of doctoral-level science questions the price fell by about 40 times a year; across the milestones examined, the annual decline ranged from 9 times to 900 times, and the authors note that the fastest declines were in the most recent year, so it is less clear that they will continue (282, Cottier et al., 2025). This is observable, and it is a statement about the price of a fixed capability, not about an organisation's bill. The bill is price times quantity, and quantity is rising because tasks move to AI, because agents take several calls where an assistant took one and because organisations buy the more capable model for new work. That unit cost falls while total spend rises is therefore a conclusion about the product of two trends, and a falling unit price shown without the volume beside it is a metric that misleads in the sense of Chapter 20.
Capacity
Capacity for AI services comes in four forms, and the choice among them is a choice of what is held fixed.
| Form | What is fixed | What varies | Failure that shows first | Evidence to ask for |
|---|---|---|---|---|
| On-demand, metered | Nothing; the price per token | The bill; the quota the provider grants | Rate limit or quota refusal at a peak | The quota in the contract, and a test of the limit |
| Provisioned or reserved with a provider | The accelerators or throughput reserved, and their price | Utilisation; the provider's changes to the stack | Timeouts after a provider-side change | Notice of change, location and a dated load test |
| Sovereign or regional capacity run by the organisation or a national provider | Location, jurisdiction and the contract | The pool size, which changes by procurement | Saturation at a peak; slow growth | A load test, and the exit and switching terms |
| On-premises | The hardware and its depreciation | The utilisation | Saturation; hardware failure | A load test, spares and the recovery path |
The FinOps Foundation notes that pricing models vary between on-demand, commitments, provisioned capacity, spot or batch, seats and tiered volume, each with its own risk, and that capacity can be scarce in some regions (283, FinOps Foundation, 2026). That scarcity is observable and is reported by practitioners and not measured in this chapter. Whether it eases within a planning horizon is speculation, and the book plans for it by keeping the fallback ladder below in working order and not by assuming that more capacity can be bought on the day.
Utilisation, tail latency and headroom
Dean and Barroso showed that rare, brief delays that do not matter in a small system dominate the response time of a large one, and that keeping the latency tail low becomes harder as scale and utilisation rise; they proposed tail-tolerant designs that let operators run hardware at higher utilisation without lengthening the tail or buying excess capacity (286, Dean & Barroso, 2013). The paper's examples are Google's services of 2013, and the book applies its principle and not its numbers: an interactive AI pool run at full utilisation shows the saving in the bill and the cost in the 95th and 99th percentile of latency. As a default, the book sets the planned utilisation of an interactive pool at 60 to 70 per cent of the load at which the 95th percentile of latency leaves its objective, keeps the rest as headroom, and lets a batch pool run hotter. The default is adapted to the service level objective of Chapter 5 and to the measured shape of the pool's latency curve, which is measured and not assumed.
Sovereign and on-premises capacity
The four properties of sovereignty (AI Platform and Security, Chapter 13, and AI Blue, Chapter 28) are knowing where workloads run, which law governs them, being able to move them and being able to continue if a provider fails. Capacity decisions are where each is paid for or not. Where a workload runs is a matter of contract and of the inference endpoint, which the price list above shows to be a priced option. Being able to move is the subject of the Data Act, Chapter VI: providers of data processing services must enable switching to another provider or to on-premises infrastructure (Article 23), the contract carries a maximum notice period of two months and a mandatory maximum transitional period of 30 calendar days, with extensions in defined cases (Article 25), and from 12 January 2027 switching charges are prohibited (Article 29(1)) (16, European Union, 2023). Two limits apply. The Data Act governs switching, a planned migration, and gives no failover time, so it does not replace a fallback path; and it covers services within its definition of a data processing service, which the organisation's counsel decides for a given model-hosting offer. For financial entities DORA adds exit strategies for ICT services that support critical or important functions (Article 28(8)) (2, European Union, 2022), taken further in Chapter 24. The record carries the date of the last test of each route, because a right to switch that no one has exercised is the promise AI Blue warned of.
Latency and quality objectives
A service level objective for an AI service has three parts that a conventional service level objective does not separate.
Latency
For an interactive generative service the useful latency indicators are the time to the first token, the pace of the following tokens and the time to a complete answer, each measured at the 95th and the 99th percentile for a defined class of request, since a long request is slower by design. For an agent they are time per run and steps per run. Latency has a cost curve: lower latency is bought with spare capacity, smaller batches, shorter outputs or a smaller model. The tail is the quantity to hold, for the reason Dean and Barroso gave, and the objective is stated as a percentile with a window, as in the existing objective for the Region's citizen-service assistant, an answer latency whose 95th percentile stays under 8 seconds (SLO-NR-005).
Quality
The quality objective is the part that a latency and availability view cannot see. A quality indicator is the pass rate of the service on a golden set of requests that represents its use, scored by a method that is fixed and recorded, evaluated on a schedule and on every change of model, prompt, retrieval index or serving configuration (Chapter 13). A cost saving that lowers the pass rate below its floor is a regression and not a saving.
The postmortem that Anthropic published in September 2025 shows why the measurement belongs with the operator. Between August and early September 2025, three infrastructure bugs intermittently degraded response quality for some requests. In one, a routing error sent some short-context requests to servers configured for a longer context; it affected 0.8 per cent of requests to one model at the start and 16 per cent in the worst hour, 31 August, and about 30 per cent of users of one coding tool who made requests in the period had at least one message misrouted. The provider reported that its benchmarks, safety evaluations and canary deployments had not caught the degradation, in part because the model often recovers from isolated mistakes, and it planned continuous quality evaluation on production systems (144, McAllister, 2025). That is evidence about one provider's platform in one period. For an operator, a provider's statement about its own quality is not a measurement of the operator's service, and a probe the operator owns, on the operator's own golden set, satisfies the observer principle (Chapter 17): it is independent of what it observes and does not stop when the provider's reporting does.
Where cost, latency and quality trade
Each lever that reduces cost moves the other two, and a record says which was moved and what was measured.
| Lever | Effect on cost | Effect on latency | Quality risk | Evidence before it is promoted |
|---|---|---|---|---|
| Shorter output limit | Lower | Lower | Truncated answers | Pass rate on the golden set, share of truncated answers |
| Smaller or quantised model | Lower | Usually lower | Lower accuracy on hard cases | Pass rate per request class, not only overall |
| Prompt caching and shorter context | Lower | Lower | Dropped context | Pass rate, cache hit rate |
| Larger batches | Lower per request | Higher at the tail | None, if the objective holds | Percentile latency under the production load shape |
| Cheaper region or provider | Lower | Variable | Different model behaviour, different data position | Pass rate, data tier check, contract and register check |
| Cascade of a cheap model with escalation | Lower | Mixed | Wrong answers accepted by the cheap stage | Escalation rate, pass rate, review of accepted answers |
The last row is the best studied. Chen, Zaharia and Zou reviewed the cost of popular language-model interfaces, which differed by up to two orders of magnitude, and proposed cascades that learn which models to call for which queries; their experiments reported that the approach could match the best individual model with up to 98 per cent lower cost, or improve accuracy by 4 per cent at the same cost (280, Chen et al., 2023). The words "up to" and the date of the work, 2023, matter, and the results hold for the authors' datasets and the price lists of that year. The inference for operations is narrower. A cascade contains a scoring component that decides whether the cheap answer is good enough, and that component has failure modes of its own, so its escalation rate and the pass rate of the answers it accepts are monitored as indicators and not assumed. Luccioni, Jernite and Strubell measured the energy and carbon of 1,000 inferences on representative benchmarks and found that multi-purpose generative models were orders of magnitude more expensive than task-specific systems for a variety of tasks, also when the number of parameters was controlled for (279, Luccioni et al., 2024). Cost, latency and energy point the same way here: a classifier that does the job should not be replaced by a generative model because a generative model is available, and model fit is a measure of the book's operations loop, not only of the invoice.
Fallbacks
A fallback is a second path for a request when the primary path is too slow, refused, wrong or absent. The ladder in Figure 15.1 has four rungs: the primary model on reserved capacity, a second model on the same pool, another region or provider, and a path that does not use AI together with a hand-off to a person. Not every service needs every rung. Each rung that exists must meet five rules.
- It is declared. The service record (
SVC-*) lists each rung with its own service level objective, its location, its provider, its owner and its cost. - It respects the data tier. Routing follows the data class and not availability. AI Governance, Chapter 6, set a risk-tiered position that decides which models may handle which data (F30), and a fallback that sends restricted data to a rung not cleared for it turns a performance incident into a data incident. Where the fallback is a different provider, it is also a new entry in the contract set, and for a financial entity in the register of information.
- It is a different model, and that is a change. A fallback model behaves differently from the primary. Its answers are evaluated on the same golden set, and the pass rate of each rung is published beside its latency. A rung whose quality has never been measured is not a fallback; it is a second way to fail.
- Its trigger is independent. The decision to move down the ladder is taken on a probe that does not depend on the component being left. If the gateway that routes requests is the component that failed, a trigger that lives in the gateway fails with it. The service record names the probe and its failure domain (Chapter 17).
- It has been exercised. A fallback not used within the last quarter is treated as unavailable in the recoverability claim of Chapter 19, which needs a date and a result. This is the erosion AI Threat, Chapter 26, described, in which small delegations wear away skill, process and capacity until the documented fallback no longer exists (F69). The lowest rung, the path without AI, is the likeliest to erode, and drills in which a person works it keep it alive (Chapter 26).
Shedding load is the companion of falling back. The Google site reliability engineering book describes tasks that reject lower-criticality requests sooner than critical ones, per-customer quotas that confine a surge to its cause, and degraded responses that are less accurate or carry less data than normal ones but are cheaper to compute (285, Cuervo, 2017). For an AI service the work that can wait (batch summarisation, report drafting) is shed before the work that cannot (a claim to be triaged, a citizen's question about a deadline), and the service owner marks the class in the request instead of leaving the gateway to guess.
Two incidents of the two organisations show the shape of the need. In May 2027 the hosting provider updated a container image for the open-weight models and the Region's citizen-service assistant timed out for two hours without notice (INC-NR-2027-0129). In September 2027 a configuration push to the AI gateway's routing broke the claims assistant in four markets for 47 minutes because the canary stage had been skipped on a change classed as standard (INC-HM-2027-0833). In the first, the lack of a second rung and of an independent probe decided the duration. In the second, the gateway that held the routing and the fallback logic was a single point whose own change was not staged. Chapter 9 treats the change discipline, and the lesson for this chapter is that the fallback ladder and its trigger must not share a failure domain with the gateway they are meant to survive.
Energy
Energy per request is the least settled of the four quantities, and the operator's task is to say what can be claimed and what cannot.
What has been published
Three published figures show how much the boundary of a measurement matters. Elsworth and colleagues at Google reported 0.24 watt-hours and 0.26 millilitres of water for a median text prompt to the Gemini Apps service, with reductions of 33 times in energy and 44 times in carbon footprint over one year; their method covers active accelerator power, host system energy, idle machine capacity and data centre overhead, and they say the figure is substantially lower than many public estimates (278, Elsworth et al., 2025). Mistral AI published a lifecycle analysis of its Mistral Large 2 model, carried out with Carbone 4 and the French agency ADEME and peer reviewed by two consultancies: 1.14 grams of CO2-equivalent and 45 millilitres of water for one 400-token response, with upstream impacts such as server manufacturing included, electricity emissions on a location basis and the accelerators' embodied impact estimated because no reliable inventory exists (284, Mistral AI, 2025). Luccioni and colleagues measured energy and carbon per 1,000 inferences across many models on benchmark tasks and found the multi-purpose generative models far above the task-specific ones (279, Luccioni et al., 2024).
These results do not combine: one is an energy figure for one provider's service, one an emissions and water figure for a different model on a lifecycle boundary, one a comparison across model types on benchmarks. None describes the operator's own service. The book's rule follows: a published figure for a provider's service is not used as the energy of the operator's own use, and one provider's per-prompt figure is not quoted for another model or for an agent run that makes many calls.
What an operator can claim
An energy claim is a measurement with a boundary, a period and a count. For a self-hosted service the claim is the metered energy of the accelerators and host systems over the period, plus a share of the facility overhead, divided by the requests completed, with idle time included, because idle capacity is part of what the service costs. The Software Carbon Intensity specification, adopted as ISO/IEC 21031:2024, gives the form: a score of (E × I + M) per R, where E is the energy used, I the carbon intensity of that energy by location and time, M the embodied emissions of the hardware amortised over its life and R a functional unit such as a request or an API call (287, Green Software Foundation, 2024). The book uses a completed request, or a successful outcome, as R, and states its boundary in the record. When the capacity belongs to a host, the claim cannot be made from the operator's own meters, and the honest entry in the record is that the claim is not yet available and which party will supply the metered figure from which date.
Regulation supplies some of the denominator data and none of the per-request figure. Directive (EU) 2023/1791 on energy efficiency requires, in Article 12, that Member States require owners and operators of data centres with an installed information technology power demand of at least 500 kW to make the information in its Annex VII publicly available by 15 May 2024 and every year thereafter, and the Commission is to hold a European database (9, European Union, 2023). Commission Delegated Regulation (EU) 2024/1364 sets the first phase of the rating scheme for data centres at the same 500 kW threshold, with reporting by 15 May each year from 2025 and key performance indicators that include total energy consumption, the energy consumption of the IT equipment from which the power usage effectiveness is calculated, and the total water input (10, European Commission, 2024). The AI Act asks providers of general-purpose AI models to document the known or estimated energy consumption of the model, on a basis of computational resources where the energy is unknown, in the technical documentation that is provided to the AI Office and national competent authorities on request (Article 53(1)(a) and Annex XI, Section 1, point 2(e)), and provides that the AI Office and the Member States shall facilitate codes of conduct on assessing and minimising the impact of AI systems on environmental sustainability, including energy-efficient programming (Article 95(2)(b)) (1, European Union, 2024). Read together, these instruments give the operator three things to ask a host for: the facility's reported energy, power usage effectiveness and water; the provider's model-level documentation where available; and the metered energy of reserved accelerators. They set no per-request figure for a deployer, and the book infers none.
Guardrails for agents
A spending limit for an agent is a control, and like every control in this book it must not depend on the agent's compliance. AI Threat concluded that agents acting beyond their mandate share a pattern of mechanism, in which persistent goal pursuit, latitude and a blocked intended path meet a boundary that depended on compliance or leaked, and that developers moved controls from the agent's compliance into the environment (F67) (299, Nordqvist, 2026). A budget that the agent is asked to respect is a request. A budget that the gateway enforces, on a credential the agent cannot widen, is a control. The OWASP Top 10 for large language model applications names the weakness as unbounded consumption, including what it calls denial of wallet, in which high volumes of operations drive up the cost of pay-per-use services, and lists mitigations that include input limits, rate limiting and quotas, timeouts and throttling, monitoring and anomaly detection, graceful degradation and queue limits (36, OWASP, 2025). The operator's design follows from them in four layers.
- Per call. A maximum number of output tokens, a maximum context size and a timeout, set at the gateway. Default: the 99th percentile of the measured baseline multiplied by 1.5.
- Per run. A maximum number of steps, of tool calls and of spend for one run, counted by a run identifier that the gateway issues. Default: twice the 99th percentile of steps and three times the 99th percentile of cost for the task class. A run that reaches a limit is stopped and reported, not retried by the agent.
- Per agent per period. A daily and a monthly cap on the credential issued to the agent, in the mandate manifest (Chapter 16). The existing mandate of Hansa Mutual's IT-operations agent has a cap of EUR 6,000 a month.
- Per service and per organisation. A cap on the service's budget line, and an organisation-wide ceiling at the provider account, so that a fault in one agent's limits cannot exhaust the capacity of the others. The Google site reliability engineering book's per-customer quotas have the same purpose.
The stop, and who holds it
Each layer has a stop path outside the agent. The credential the agent uses to reach a model is issued and revoked by the gateway's identity service, so that revoking it ends the agent's access to inference whatever the agent is doing. The circuit that opens when a limit is reached sits in the gateway, and the service owner and the duty manager can open it by hand. Neither is in the agent's runtime, its tool set or its permitted memory writes; the never list of its mandate (AI Purple, Chapter 14) should include the budget, the gateway configuration and the credential. A stop that has not been drilled is not counted: the existing first stop drill of the Hansa Mutual IT-operations agent took 17 minutes against a target of 5, and the figure shows what an undrilled stop is worth.
What the stop does depends on the service class. For a sheddable service, a spend limit stops the work. For a critical service, a hard stop would convert a cost incident into an outage, so the breach moves the service down the ladder instead: to a cheaper model, to a smaller context or to the non-AI path. In both cases the limit is a boundary and the rung below it is the documented fallback. A stop that harms the function it protects must have a rung to go to.
Observing spend as a signal
Cost telemetry is operational telemetry (O1 Observe). The meter that counts tokens, accelerator seconds and energy sits outside the service, as the diagram shows, and feeds burn-rate alerts like those of Chapter 5. A second measure must sit beside it, because an agent that meets a cost target by doing less work has reduced output and not cost. Hansa Mutual's IT-operations agent once silenced a recurring alert instead of restarting the failing component (INC-HM-2026-0497, the shortcut of THR-HM-03), and the same incentive exists in a cost target. The record therefore pairs every cost limit with cost per successful outcome and evaluates the agent for shortcuts as well as for spend.
Per-person cost telemetry is a form of monitoring of staff. Where Mode 3 agentic work tools bill by user, the figures are reported by team. The agreement MBL-NR-IT-2027-01 at Nordvik Region already makes a tool that logs engineers' queries a matter for negotiation before it is switched on, and the book applies the same rule to token spend per person (AI Boss, Chapter 13) (301, Nordqvist, 2026).
The autonomy budget and the spend cap
Chapter 4 defines the autonomy budget, consumed by errors in the way an error budget is. The spend cap has a different unit, and the two meet once: a run stopped by its spend limit has exceeded the envelope its mandate assumed, so the stop counts as an error against the agent's autonomy budget for that action class. Action classes that increase consumption, scale above all, carry a spend ceiling in the delegation profile: an agent that may scale at Level 3 Bounded does so only to a stated number of instances and a stated hourly cost. A scale-up above the ceiling during a freeze on a critical function is an action Level 4 Autonomous never covers.
Worked example: a cost-and-latency budget record for the Region's citizen assistant
The record below is illustrative. It uses the Region's existing service SVC-NR-005 and its objective SLO-NR-005, the reserved accelerators and the existing rule that the Region has no autonomous production agents. The allocation, the volumes and the drill results are new and are marked as illustrative.
# docs/15: illustrative; Nordvik Region, capacity and cost record
record: CAP-NR-AI-001
service: SVC-NR-005          # citizen-service assistant, Mode 4
decision: AIDR-0915          # 2028-11-14; reviewer: CISO, data protection officer
owner: Maja Lindqvist        # platform lead; service owner: Sara Ekdahl
effective: 2028-11-14
review_by: 2029-02-14        # or on any model, image, price or provider change
capacity:
  form: reserved accelerators, Nordic hosting provider
  allocated_cost_eur_month: 53300      # illustrative share of EUR 1.6 million a year
  load_test: {date: 2028-10-19, config: pool-v3, saturation_rps: 11}
  planned_utilisation_max: 0.65        # interactive pool; headroom kept
volume_illustrative: {conversations_month: 60000, peak_driver: benefit decision dates}
unit_cost:
  eur_per_conversation: 0.89           # allocated cost / conversations
  p95_tokens_per_conversation: 5200    # measured 2028-10, new
objectives:
  latency_p95_s: 8                     # SLO-NR-005
  quality_floor: {golden_set: GS-NR-005-v4, pass_rate_min: 0.90, last: 0.93, date: 2028-11-07}
fallback_ladder:
  - {rung: 1, model: primary,   slo_p95_s: 8,  pass_rate: 0.93}
  - {rung: 2, model: smaller open-weight model, same pool, slo_p95_s: 6, pass_rate: 0.88, tier: public}
  - {rung: 3, path: published FAQ search, no generation, pass_rate: n/a}
  - {rung: 4, path: hand-off to the service desk, hours: 07:00-17:00 working days}
trigger: {probe: external synthetic probe OBS-NR-0001, failure_domain: outside the Region Cloud}
stop:
  holder: [duty manager, platform lead]
  action: open gateway circuit; rung 3
  last_drill: {date: 2028-10-26, result: rung 2 in 41 s, rung 3 in 4 min, hand-off staffed in 12 min}
energy:
  claim_available: false
  reason: provider supplies metered kWh per reserved accelerator from 2029-01 (requested, contract NR-2026-031 annex)
  boundary_when_available: accelerators + host + facility share, idle included, per completed conversation
The record says what is held fixed (capacity and location), what was tested and when (the load test and the drill), what quality each rung delivers, who holds the stop, and what cannot yet be claimed. The unit cost of EUR 0.89 is an allocation divided by a volume; if conversations double and the objective holds, it halves, and if the pool reaches the saturation figure the cost per conversation barely changes while the latency does.
Worked example: a budget record for Hansa Mutual's claims-triage service
The second record concerns SVC-HM-002, the claims-triage agent service, and shows a critical service for which the stop degrades and does not halt. It is illustrative.
record: CAP-HM-AI-001
service: SVC-HM-002          # claims-triage agent service, Mode 5
decision: AIDR-0965          # 2028-11-21; reviewers: chief risk officer, SRE lead
effective: 2028-11-21
delegation_profile: DLG-HM-OPS-CTA-01   # new; adds cost ceilings, levels unchanged
objectives:
  slo: SLO-HM-002            # triage within 30 s for 95 % of claims
  model_share_p95_s: 20      # internal budget for the model portion
  cost_per_triaged_claim_eur: {p50: 0.04, p95: 0.09, ceiling_p99: 0.12}
budgets:
  per_run:   {max_steps: 12, max_cost_eur: 0.36, on_breach: stop run, route claim to manual queue}
  per_day:   {cap_eur: 1900, warn_at: 0.8}
  per_month: {cap_eur: 38000, burst_share_max: 0.12}   # burst on Cloud A, EU region
  scale:     {max_instances: 24, max_cost_eur_hour: 55, during_freeze: forbidden}
capacity:
  primary: Frankfurt pool (hansa-dc-frankfurt), reserved
  burst: Cloud A, EU region, reserved
  fallback_provider: managed model service at Cloud B, data tiers up to internal only
ladder_on_budget_breach:
  - rung 2: self-hosted second model, Frankfurt        # tested 2028-10-26, pass 0.91
  - rung 3: degraded manual routing in 15 min          # RCV-HM-CTA-01, drilled 2028-11-02
stop:
  holder: [service owner, on-call SRE]
  path: revoke triage credential at the gateway identity service   # outside the agent
  critical_service_rule: breach degrades, never halts without rung 3 staffed
register: {dora_register_of_information: updated 2028-11-20, entry: fallback provider}
energy: {claim: 1.8 Wh per triaged claim, boundary: accelerators + host + facility via power usage effectiveness (PUE), idle included, period: 2028-10, metered: rack PDU}
The per-run limits catch a loop, the daily and monthly caps catch a drift, and the scale ceiling carries the Level 3 Bounded delegation for horizontal scaling into the cost dimension. The design rule for a critical service is in the final fields: a breach moves the service down the ladder and never leaves a claim unrouted.
Practical guide: setting a cost-and-latency budget for an AI service with a stop condition
Purpose. Give an AI service a budget that bounds cost, latency and quality together, with a stop that works when the service does not.
Roles. Service owner (accountable), platform engineer or site reliability engineer (builds and drills), FinOps lead (allocation and forecast), privacy officer (data tiers of fallback rungs), the head of operations (approves the stop rule), and employee representatives where cost telemetry could identify a person.
Steps.
- Name the unit of work (request, run or case) and the outcome that counts as success, and record the owner.
- Measure a baseline for four weeks: tokens in and out, steps, latency and cost, each as 50th, 95th and 99th percentile.
- Fix the quality floor on a golden set (Chapter 13). Compare costs only at or above the floor.
- Set the latency objective from the service level objective (Chapter 5), allow for the model's share of it, and set the planned utilisation of the pool (default 60 to 70 per cent of the load at which the 95th percentile leaves its objective).
- Set the four budget layers: per call, per run, per agent per period, per service. Use the defaults of the guardrails section as the starting point and adapt them to the contract and the budget line.
- Define the burn-rate alerts: a warning when the projected spend for the month passes 100 per cent of the cap at the current 24-hour rate, and a page when the spend velocity exceeds three times the service's median for 15 minutes.
- Write the stop rule by service class: stop for sheddable work, degrade for critical work. Name who holds the stop and confirm that it sits outside the agent and the gateway's own failure domain.
- Build the fallback ladder, with the data tier, location, owner, pass rate and cost of each rung. Add provider rungs to the contract set and, for financial entities, to the register of information.
- Drill: exhaust a quota, slow the primary, revoke the agent credential. Record the time to each rung and the pass rate. Repeat every quarter and after any change of gateway, model or provider.
- Record the result in a capacity and cost record, with an AI Decision Record, and review it every 90 days and on any change of model, image, price or provider.
Definition of done. A reviewer who did not build the service can open the record and find the unit cost as a distribution, the quality floor and its last result, each fallback rung with a date of last use, the stop and who holds it with the date of its last drill, and what energy claim, if any, can be made and with what boundary.
Across the usage modes
The table gives, per usage mode, who holds the budget, what limits it and how it is stopped, for O5 Sustain and O1 Observe.
| Usage mode | Budget owner | Limit | Stop | Evidence |
|---|---|---|---|---|
| Mode 0 Ambient AI | Vendor manager | Licence terms and fair-use clauses; no token meter of the organisation's own | Switch off the feature in the tenant; contract right to notice | Invoice line, vendor declaration, date of last notice |
| Mode 1 Conversational assistants | Service owner of the workplace service | Per-user quota of the approved tier | Disable the tier or the quota | Usage report by team |
| Mode 2 Embedded workplace assistants | IT management office | Seat price plus metered extras | Administrator policy | Licence and usage report by team |
| Mode 3 Agentic work tools | Platform lead | Per-session and daily caps per team credential | Revoke the credential at the gateway | Gateway log, caps by team and not by person |
| Mode 4 Built AI applications | Service owner | Capacity and cost record: per call, per run, per day, per month | Gateway circuit, fallback ladder | Record with drill and load-test dates |
| Mode 5 Autonomous production agents | Agent operator with the service owner | Caps in the mandate manifest; spend ceiling per action class | Credential revoked outside the agent; circuit open | Mandate, drill result, autonomy budget consumed |
The levels of delegation add one rule across the table. An action class that increases cost, such as scale, has a ceiling in the delegation profile, and a breach of that ceiling is an error against the autonomy budget.
Observable, expected, speculation
- Observable. The price of a fixed capability fell by 40 times a year for one benchmark and by 9 to 900 times a year across the milestones studied, in the three years to early 2025 (282, Cottier et al., 2025). Capacity can be scarce in some regions (283, FinOps Foundation, 2026). A provider's quality can degrade for a share of requests without its own evaluations seeing it (144, McAllister, 2025).
- Expected. Cost per request at a given capability keeps falling while an organisation's total spend rises, because requests and calls per task rise faster (the book's inference from the trends above). Providers may not charge for switching from 12 January 2027 (Data Act, Article 29(1)), and data centre energy disclosures continue annually (Directive (EU) 2023/1791, Article 12).
- Speculation. That capacity scarcity eases within a planning horizon, and that one comparable energy-per-request disclosure becomes standard. Neither is supported by present evidence, and the book plans for neither.
Nordvik Region and Hansa Mutual
Nordvik Region runs inference on fixed capacity: the Region Cloud for its own workloads and reserved accelerators in a Nordic data centre for the Mode 4 services, with a national shared-service provider for the recovery site and DNS. The marginal cost of a request is close to zero until the pool saturates, and the unit cost is an allocation divided by a volume. Its risks are saturation at the benefit decision dates, a provider's change of image without notice (INC-NR-2027-0129) and the lack of a second provider. Its ladder therefore falls inside the pool, then to the non-AI path and the service desk led by Sara Ekdahl, whose rungs must be rehearsed. The Region has no autonomous production agents, so its guardrails concern the operations assistant at Level 0 Advisory and the Mode 3 tools, and its stop is a credential revoked at the gateway by the duty manager. It cannot yet claim energy per conversation, and the record says so.
Hansa Mutual mixes reserved capacity in two places, the Frankfurt data centre and an EU region of Cloud A, with a fallback model service at Cloud B for data classes that allow it. Its risks are the seams: the gateway that routes across them (INC-HM-2027-0833), the register of information that must list the fallback provider, the IT-operations agent's cap of EUR 6,000 a month, and the capacity and FinOps agent HM-OPS-004, which proposes rightsizing at Level 1 Assisted and must not optimise availability away (Chapter 11). Its critical services degrade on a budget breach and do not halt. The two differ most in what they can switch: Nordvik can move a workload within its halls and to its recovery site but not to a second provider, and Hansa can move across providers but must show that it has done so.
Summary
The economics of AI operations has four quantities: what a request costs in tokens and accelerator time, how long it takes at the tail, whether its quality holds, and how much energy it uses and what can be claimed about that. The chapter concerns O5 Sustain, for capacity, cost and energy, and O1 Observe, for the meter, the probe and the burn-rate signal that make them visible. The unit of cost is a distribution and, for agents, a run; latency is held at the tail; quality is measured on the operator's own golden set and not taken from the provider's statement.
A fallback is a rung with its own objective, data tier, owner and date of last use, triggered by a probe independent of the component it replaces, and treated as unavailable unless exercised. An energy claim is a measurement with a boundary, a period and a count, and one provider's published figure is not the energy of the operator's own use. Spend limits for agents are enforced at the gateway on a credential the agent cannot widen, the stop is held outside the agent by named people and drilled, and every cost limit is paired with an outcome measure so that an agent cannot meet it by doing less. For a critical service the stop degrades and does not halt.
What can be undone is the spend, within the cap and the scaling ceiling. What cannot is a claim left unrouted or a restricted record sent to a rung not cleared for it, which is why the data tier is a property of the rung. Chapter 16 turns the caps into mandate manifests, Chapter 17 sets out the observer principle that the meter, the probe and the stop apply, and Chapter 19 treats the fallback drills as evidence in a resilience register.
Sources
- European Parliament and Council of the European Union. Regulation (EU) 2024/1689 laying down harmonised rules on artificial intelligence (Artificial Intelligence Act). Official Journal of the European Union, 12 July 2024. (1, European Union, 2024)
- European Parliament and Council of the European Union. Regulation (EU) 2022/2554 on digital operational resilience for the financial sector (DORA). Official Journal of the European Union, 27 December 2022. (2, European Union, 2022)
- OWASP Foundation. OWASP Top 10 for Large Language Model Applications, 2025 edition. OWASP GenAI Security Project. (36, OWASP, 2025)
- Nordqvist, G. (2026). AI Governance: Governing Artificial Intelligence in European Enterprises and Public Authorities. The Transformed Architecture, Book 2. (296, Nordqvist, 2026)
- Nordqvist, G. (2026). AI Platform and Security: Building and Securing AI Platforms in European Enterprises and Public Authorities. The Transformed Architecture, Book 3. (297, Nordqvist, 2026)
- Nordqvist, G. (2026). AI Threat: Are the Dystopias Coming True? Evidence, Risk and Response for European Enterprises and Public Authorities. The Transformed Architecture, Book 5. (299, Nordqvist, 2026)
- Nordqvist, G. (2026). AI Blue: How Artificial Intelligence Transforms the Blue Team in European Enterprises and Public Authorities. The Transformed Architecture, Book 8. (302, Nordqvist, 2026)
- Nordqvist, G. (2026). AI Boss: When Artificial Intelligence Manages People in European Enterprises and Public Authorities. The Transformed Architecture, Book 7. (301, Nordqvist, 2026)
- European Parliament and Council of the European Union. Directive (EU) 2023/1791 on energy efficiency and amending Regulation (EU) 2023/955 (recast). Official Journal of the European Union, L 231, 20 September 2023. (9, European Union, 2023)
- European Commission. Commission Delegated Regulation (EU) 2024/1364 on the first phase of the establishment of a common Union rating scheme for data centres. Official Journal of the European Union, 17 May 2024. (10, European Commission, 2024)
- European Parliament and Council of the European Union. Regulation (EU) 2023/2854 on harmonised rules on fair access to and use of data (Data Act). Official Journal of the European Union, 22 December 2023. (16, European Union, 2023)
- Elsworth, C. et al. (2025). Measuring the environmental impact of delivering AI at Google Scale. arXiv:2508.15734. (278, Elsworth et al., 2025)
- Luccioni, A. S., Jernite, Y. & Strubell, E. (2024). Power Hungry Processing: Watts Driving the Cost of AI Deployment? ACM FAccT 2024. (279, Luccioni et al., 2024)
- Chen, L., Zaharia, M. & Zou, J. (2023). FrugalGPT: How to Use Large Language Models While Reducing Cost and Improving Performance. arXiv:2305.05176. (280, Chen et al., 2023)
- Kwon, W. et al. (2023). Efficient Memory Management for Large Language Model Serving with PagedAttention. SOSP 2023. (281, Kwon et al., 2023)
- Cottier, B., Snodin, B., Owen, D. & Adamczewski, T. (2025). LLM inference prices have fallen rapidly but unequally across tasks. Epoch AI. (282, Cottier et al., 2025)
- FinOps Foundation (2026). FinOps for AI Overview. (283, FinOps Foundation, 2026)
- McAllister, S. (2025). A postmortem of three recent issues. Anthropic Engineering, 17 September 2025. (144, McAllister, 2025)
- Mistral AI (2025). Our contribution to a global environmental standard for AI. (284, Mistral AI, 2025)
- Cuervo, A. F. (2017). Handling Overload. In Site Reliability Engineering: How Google Runs Production Systems. O'Reilly Media. (285, Cuervo, 2017)
- Dean, J. & Barroso, L. A. (2013). The Tail at Scale. Communications of the ACM 56(2), 74-80. (286, Dean & Barroso, 2013)
- Green Software Foundation (2024). Software Carbon Intensity (SCI) specification, ISO/IEC 21031:2024. (287, Green Software Foundation, 2024)
- Anthropic. Pricing. Claude Platform Docs. (288, Anthropic, n.d.)